 Recently there has been some controversy over the research into STAP (Stimulus-triggered acquisition of pluripotency) cells. The supposedly breakthrough discovery made by Haruko Obokata and his team was published into the highly established Nature journal. However, after a series of investigations into the results of the experiments carried out by Obokata, it was finally retracted from the journal. The study claimed that bathing adult mouse cells in acid converted them into totipotent stem cells, meaning they have the ability to turn into any type of cell in the body, including cells of the placenta. This essentially means they have the potential to create life. This research, when it was released, was huge news for the medical industry as it provides a great alternative to reprograming genes to create the desirable type of cell. This source of regenerative medicine was a giant leap in the field which is why it raised questions into the accuracy of the results. Concerns were raised as other scientists claimed it was too good to be true which lead to the research team, RIKEN, based in Japan launching an investigation into how the results of the experiments were found. Additionally, scientists around the world started to look into it, for example, Jose Silva, who is a stem cell researcher at the University of Cambridge, attempted to repeat the experiments and was unsuccessful. Numerous others also attempted to peer review the results and were unable to replicate the production of the STAP cells as the full protocol was not published and made publicly available. This raised further questions into the reliability of the ideas that Obokata and his team had proposed. As others continued to peer review the experiment, many flaws were uncovered which led to the research team being scrutinised under the media. After thorough discussion, the papers were retracted from the Nature journal and the authors were forced to admit that their research was not valid and that they had not uncovered a real source of regenerative medicine. The media played a huge part in this controversial story as they, at first, sparked interest in the research which gained the attention of many major science organisations and universities. This led to excitement in the medical field and numerous high profile scientists opted to peer review the research in the hope that these STAP cells could become universally accessible, providing potential for the future. However, having done so, concerns were raised and the media was quick to catch on and very quickly, the papers were being scrutinised and frowned upon. The media generated a lot of pressure and they were particularly harsh to those leading the research team. They acted immorally and began delving into the personal life of the scientists, and in particular, Yoshiki Sasai could no longer deal with the criticism and unfortunately committed suicide. This highlights how the media were wrong in their portrayal of the scientists and pushed boundaries to the extent where they affected the team psychologically. In short, although the peer review process was necessary to analyse the reliability of the experiments involving STAP cells, the media were unethical in their approach to the scandal and blew the issues out of proportion. The retraction of the papers was important as the journal strictly contains scientifically correct research, which does highlight the importance in the peer review process to prove the results wrong. References:
1 Comment
I recently read an article on the breakthrough science that is CRISPR/Cas editing. CRISPR can effectively manipulate any gene in any species for the purpose of genetic engineering and either alter, remove or replace that target gene. This advanced technology has been applied to real life situations, such as fixing genetic diseases in animals or preparing livestock for xenotransplantation to help those in need of organ donors. The possibilities are great for CRISPR and they could provide hope for the future in terms of curing human genetic diseases and removing hereditary diseases from the gene pool.
CRISPR effectively targets and cuts genes enabling small scale alterations that can affect the individuals health and their genotypes. This could be hugely beneficial for the future as many stuck with incurable diseases could potentially live disease-free. There are obvious risks associated with this technology such as stimulating the onset of mutations in genes that weren’t supposed to be edited. This could be problematic in terms of health risks but through further development and research CRISPR should improve in efficiency and become more specific. In summary, the discovery of CRISPR-cas technology has transformed biological research and has sped up our progress in the medical field. https://www.sciencenews.org/article/crispr-inspires-new-tricks-edit-genes I completed an online future learn course on biochemistry which was both interesting and useful as it gave me more of an idea about what biochemistry entails and the different jobs that involve this area of science. Over the first week, I watched a number of videos and read articles about biochemistry in general. These videos involved listening to a number of experienced professors who have a background in biochemistry after having studied it at university and now putting their knowledge into practice in their careers. Out of the topics covered, I learnt more about basic biochemistry skills and had a go at the random quizzes that were set by the course. To round up the first week I took part in an online discussion about what I felt biochemistry meant to me, in which I discussed how different aspects of biology and chemistry overlap. In week 2 I was introduced to metabolism and energetics again looking at the timeline of significant discoveries in this area. The articles I read and the videos I watched interested me as they involved learning more about enzymes and proteins and how they are involved in both the lab and in the body. This was also directly linked to solving energy problems through the use of enzymes in biochemistry as many of the professors talked about the use of bioenergy and the potential for the future. Finally, in week 3 there was more of a focus around synthetic biology and the production of natural products and drugs for the use of the medical industry. This involved various articles around vitamin C as well as an experiment involving measuring the vitamin C content of aqueous solutions. Many of the videos delivered by the different professors were focused on the future of biochemistry for the future such as its importance in the creation of antibiotics, as well as its relation to plant biochemistry. To finish off this course I was informed about different career paths involving biochemistry which helped me gain a clearer picture of its application to real life problems. To add to this, the ‘breadth of biochemistry’ article gave me an idea of the skills required to enter this area of work, such as advanced analytical skills, problem solving and good communicative skills.
Investigate the effect of different sampling methods on estimates of the size of a population7/1/2016 When calculating the abundance or distribution of an organism, there are numerous different methods that are used. These methods include quadrats, both square and point, transects and mark release and recapture involving the Lincoln index. All of these methods have their advantages and disadvantages and affect the accuracy of the population size estimate.
Quadrats This involves a frame, usually square, acting as the area in which the sample of the population will be taken. The quadrat is laid on the ground at a random point. This random point may be chosen by a random number generator and the quadrat placed on a coordinate grid. Once the quadrat is on the ground, a value for the estimated population can be obtained through either individual counts or percentage cover. Both of these are examples of quantitive sampling techniques as the results are quantifiable. A number of quadrats are laid down at different points and a mean of the population size is calculated. This number is then multiplied by total area to gain an estimation for the whole area. Quadrats are advantageous because they are simple and easy to use and because of the random nature of their position, they provide an objective result. There are however limitations including the problems with the sample area that can be analysed and deciding whether or not to include those organisms on the edges of the quadrat. Another major issue is that they cannot be used to examine fast-moving animals as they are not present in the quadrat for long enough to be taken into account. A final issue would be with the randomness of the sample site as there is often bias as to where the quadrat is placed, especially if they are thrown on the ground to determine the area to measure. Another type of quadrat is the point quadrat which is essentially a horizontal bar consisting of pins which stick in the ground. The organisms that these pins come into contact with are measured to achieve a population estimate. These are quick and efficient and don’t squash any vegetation meaning they are more ethical to use. Additionally, they create a clearer picture as the organisms are easier to see. The drawbacks to this method is that it is limited to habitats with soil as the pins are unable to stay upright in any other material. As well as this, they are unsuitable for animals as the pins cannot touch them. The final limitation would be that it is easy to miss out the rarer, smaller species using pins. ACFOR scale This scale is used for measuring the abundance of species and is very subjective as it involves the scientist using the ranking scale to determine a value for the population size. The scale ranges from A meaning abundant to R meaning rare and either is calculated by the percentage cover or the number of organisms to work out how common the organism is in that particular area. The major issue with this is that it is subjective, meaning the same result may not be achieved upon repeats. As well as this it is hard to say exactly the point at which the value goes from abundant to common or occasional to rare. This ties in with the limitation of the scale being subjective. To add to this, different species may be more easily recognised which has a downside as it causes bias and may result in the scientist identifying that particular species as more abundant due to it being more clear and easier to see. Transects Transects are used to systematically sample a site meaning it is not a random method. This method involves stretching a tape between 2 points and recording very individual organism, whether that is a plant or an animal, that touches the tape. Transects are positioned so that as you move along the tape, there is environmental change, meaning the measurements taken are not replicates but in fact completely different readings. An alternative method would be the belt transect involving 2 tapes aligned and the ground between them is surveyed. Quadrats can also be used along these tape measures to achieve systematic samples of the population at different stages along the tape. This is great for measuring the distribution of organisms dependent on changes in abiotic factors because these factors will change as you move along the tape. To look at these correlations between population size and abiotic factors such as soil pH, samples must be taken at regular intervals along the tape measure. Mark, release and recapture This method is used to estimate the population size of a certain species in a particular area. To do this you collect a sample of the population by using, for example, netting or a pitfall trap, and recording the number of individual organisms caught. Before releasing these organisms, they must be marked. After a suitable time period, repeat this process in the same area and capture some more organisms. Record those organisms which are marked and count those which are unmarked. The Lincoln index is then used to estimate the population size. The total population size equals the number of animals captured first multiplied by the number of animals recaptured the second time all divided by the number of marked organisms recaptured. This method is beneficial for calculating population sizes when you cannot see the organisms in their habitat, for example crabs. However there are numerous limitations with the method because it assumes there have been no births, deaths or migrations over the sampling period. As well as this, there is a possibility that marking the organism reduces the individual’s chance of survival, for example by inhibiting their visibility, or decreasing their ability to move, both of which can affect the estimate for the population size. Another assumption made is that the individual organisms redistribute themselves evenly, whereas in fact they may be more concentrated in the place of release which can affect results. A final limitation is that the method assumes all organisms are equally likely to get caught, when in fact some organisms are trap-happy and some are trap-shy. This affects the population estimate using the Lincoln index because those organisms that were caught in the first place and then marked, are either the ones likely to get caught again (trap-happy) or have learnt from their mistakes and will avoid being caught again (trap-shy). Overall each method has its advantages which makes them suitable for estimating populations of certain types of organisms, for example, the mark, release and recapture method involves moving organisms whereas quadrats are for organisms that do not move. We can see that, however, each method has its own limitations whether that can affect the accuracy of the population size value. Moreover, the style of sampling, whether it is random, systematic or stratified can affect the reliability of the results as it may lead to bias and the results might not be an accurate representation of the population size. I will be investigating the effect of temperature on the abundance of rabbits in a given area. The organism I will be investigating will be the rabbit and I must ensure it is the same species of rabbit to ensure valid results as different species of rabbit may prefer different temperatures. My independent variable is temperature and to carry this out I will measure the population of the rabbits in a given area at different times of the year and therefore at different temperatures. I will take readings on days where the temperature is roughly 0°C, 5°C, 10°C, 15°C, 20°C, 25°C and 30°C and will use various thermometers in the area to obtain an average value for the temperature. I will repeat my readings at least three times at each temperature to improve my reliability. The dependent variable will be the population size of the rabbits in the given area. To measure this I will use the mark, release and recapture method whereby the rabbits are safely caught using a rabbit trap are marked with a band and then recaptured. These rabbit traps will be randomly distributed within the marked out area using a random number generator and the traps are placed on a coordinate grid. Those of which are marked and unmarked are noted and counted again. The time period over between release and recapture will be 120 minutes and this will be one of my control variables. Using the Lincoln index I will put together these values to obtain an estimate of the population in that area. My control variables will be the availability of food meaning there should be no lack of food in the area otherwise this may put off rabbits and affect the results. This may mean that when there is significantly less vegetation, putting in place food substitutes to maintain a constant food supply. As well as this, I will control predation in the area, preventing animals such as foxes from affecting the rabbit abundance.
There are issues associated with this experiment as it assumes there are no deaths, births of migrations. Therefore to take these into account I will make a note of the time of year the readings were taken to work out if they were taken before, during or after breeding season so I know of any external influences on the results. As well as this, when carrying out the mark, release and recapture sampling method, I will ensure that the way in which the rabbit is marked is safe, ethical and will not affect their chance of survival by reducing their movement which would therefore affect the results. Another issue with this would be that assumptions are made with how effectively the rabbits will be distributed after being released. I will take into account that they will not be evenly distributed which means they are likely to be more abundant in certain areas. To overcome this problem, I will leave them for 120 minutes (2 hours) to allow more time for them to spread out. Method:
Safety:
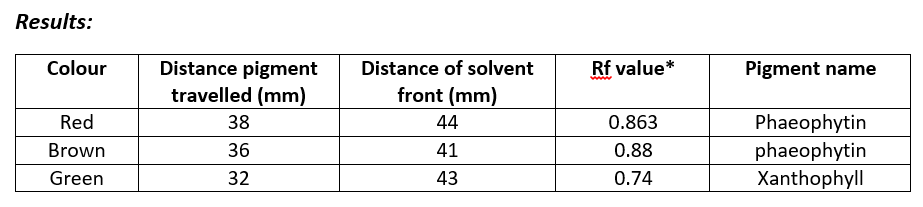 *Rf value: distance travelled by pigment (mm) / distance travelled by solvent front (mm)
Littorina saxatilis is more commonly known as the rough periwinkle which is a species of small sea snail. Hypothesis I predict that as the exposure increases due to increased wave action the size of the periwinkles will decrease. The reason I predict this is because the strong force produced by powerful wave action can dislodge the periwinkle from its position on a rock. Therefore the smaller the periwinkle the less likely it will be displaced from the rock. This means that as the wave exposure decreases, therefore in more sheltered areas, the morphology of the periwinkle is likely to increase as there is less chance the waves will be powerful enough to remove the periwinkle from the rock. Null hypothesis There is no statistically significant difference and the exposure has no direct effect on the morphology of the periwinkle. Method
Control variables
There are other important variables that cannot be controlled due to the fluctuating nature of the shore in which the experiment was undertaken. Because both the exposed and the sheltered shore are open to environmental change, variables such as temperature, salinity and competition between other organisms cannot be controlled which could influence the results. Instead of controlling these variables, the best approach is to take a record of the temperature, pH and the abundance of living organisms such as limpets and other species of periwinkle to give an indication of the level of competition in that area. By taking these uncontrollable variables into account it helps improve the validity of the results as it makes us aware of the other variables that can affect the results, so we know it is not just the level of exposure affecting the morphology of the periwinkle. Risk assessment There are risks involved to do with the shore in which the experiment took place. Both the exposed and sheltered shore could be seen as potentially quite dangerous because the rocks that the periwinkle inhabits are slippery due to the seaweed and the water, meaning there is a risk of falling over. To reduce the likelihood of falling over, protective and sturdy footwear is to be worn. 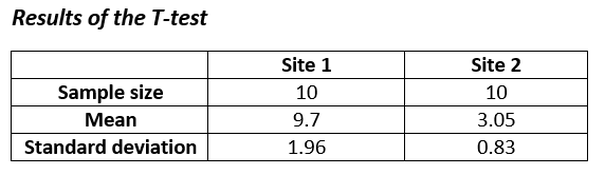 T = 9.88 Degrees of freedom = 18 Critical value = 2.101 The calculated value of 9.88 is greater than the critical value of 2.101 (p=5%, degrees of freedom = 18). Therefore we can reject the null hypothesis of no statistically significant difference between the two means at the 5% significance level. Conclusion When comparing the morphology of the periwinkle on the exposed and the sheltered shore there is clearly a difference which suggests the level of wave exposure has a great effect on the size of the Littorina saxatilis. The results from the t-test also back up this hypothesis. Upon evaluation of the results of the greater the wave exposure, the smaller the periwinkle. This is shown as the periwinkles from the exposed shore had significantly smaller periwinkles compared to those of the sheltered shore. The reason for this correlation is because a greater wave exposure directly affects the ability of the periwinkle to stay attached to the rock. Therefore, those periwinkles under greater stress, that are more exposed to the waves, are smaller to reduce the likelihood of them falling off and it makes it easier to remain glued to the rock. This difference in the morphology of the Littorina saxatilis on the exposed and sheltered shore has arisen due to natural selection whereby the periwinkle with the favourable characteristic for that area has selective advantage and is more likely to survive and go on to reproduce and pass down their favourable genes. In this way, for example, the smaller the periwinkle in an exposed shore, the more likely they are to survive and pass down their advantageous genotypes to produce offspring which also show the phenotype of small size.88 References
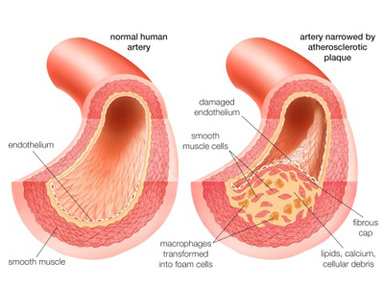
I recently read this article and I was intrigued about how nutrients in red meat can affect the risk of you developing atherosclerosis.
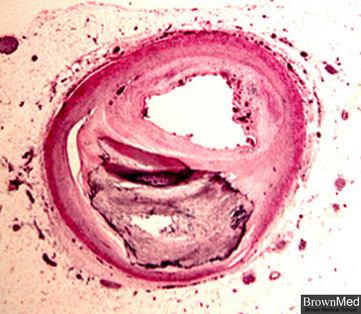
Various experiments have been undertaken involving mice to investigate further into what nutrients present in red meat have an effect on atherosclerosis. The team of scientists from Cleveland Clinic Learner Research institute in Ohio fed the mice a diet high in carnitine which is a substance found in red meat. They found that whilst feeding the mice this diet the incidences of atherosclerosis increased, however, to compare their results they also fed mice with supressed gut flora the exact same diet and found that there was no increase in atherosclerosis. Based on previous knowledge we already know that certain bacteria in the intestine use the substance carnitine as an energy source, and when broken down, a waste product known as trimethylamine (TMA) is produced. This TMA is then converted at the liver into TMAO, which is the substance that brings about this increased risk of atherosclerosis. From the mice experiment, they found that a carnitine-rich diet boosted certain bacteria types and as a result it increased the level of TMAO. It is this TMAO that increases the uptake of cholesterol likely to build-up and cause plaques and the TMAO will also prevent the cholesterol from being broken down by macrophages. Therefore this can lead to atherosclerosis developing. To back this evidence up, a series of further tests underwent only to find that meat-eaters produced higher levels of TMAO than vegetarians after they were both fed carnitine, which suggests that those meat-eaters, who eat meat on a regular basis, had more bacteria which produce TMA in the intestine. QUICK SUMMARY - These experiments suggest that eating red meat regularly could affect our arteries leading to an increased risk of developing atherosclerosis. Red meat contains carnitine which boosts the number of bacteria which use carnitine to produce energy. These specific bacteria produce TMA as a waste product when breaking the carnitine down, which will be converted into TMAO in the liver. It is this TMAO which is linked to an increased risk of development of atherosclerosis. https://www.newscientist.com/article/dn23352-red-meat-boosts-gut-bugs-that-raise-heart-disease-risk/ Introduction Atherosclerosis is a build-up of plaques (fatty deposits) on the inside of the arteries. A plaque can build up until it restricts the flow of blood through the artery which increases blood pressure and there is a chance of the plaque completely blocking the artery to a point when no blood can pass through. Plaque tends to build up in the arteries surrounding the heart (coronary arteries) and neck (carotid arteries). The problem with restricted blood flow is that organs become damaged and stop working properly which could be fatal. Also if a plaque ruptures it will lead to the formation of a blood clot which could potentially block off the blood supply to the heart or brain resulting in a heart attack or stroke. In this way atherosclerosis is linked to peripheral arterial disease where the blood supply to the legs is blocked and coronary heart disease where the coronary arteries become clogged with plaques. How does atherosclerosis develop? It begins with damage to the endothelial lining of blood vessels which may be caused by high blood pressure or the chemicals in tobacco smoke. Atherosclerosis occurs in arteries rather than veins because the endothelial lining is more likely to get damaged when the blood is flowing under high pressure. Once the damage to the lining has occurred, the body responds and signals for white blood cells to arrive at the site. These cells accumulate chemicals in the blood such as cholesterol which is one of the main constituents of plaque. As a result of accumulation of these chemicals an atherome will form on the arterial lining. Calcium salts and fibrous tissue also build up and surround the plaque which hardens it, therefore this area of the artery will lose some flexibility. This build-up of plaque will narrow the lumen of the artery which increases blood pressure. Higher blood pressure will cause further damage elsewhere leading to more build-up of plaques. As a result blood pressure will get even higher which will cause more problems. Effect on health? Atherosclerosis leads to a raised blood pressure - a higher pressure will damage smaller delicate blood vessels. For example: blood vessels leading to the kidneys the eye and the brain will become damaged as these vessels are not strong enough to take the force of an increased pressure of blood. Aneurysms – as the plaque continues to accumulate, blood can build up behind the clump which puts the artery wall under more pressure than usual which causes it to weaken. This may lead to the artery splitting open causing internal bleeding. Heart disease - angina is a common example of heart disease involving blockage of the coronary arteries. As plaques build-up in the arteries surrounding the heart, blood flow becomes more and more restricted. As a result the heart is pumping on a restricted supply of oxygen meaning it may have to respire anaerobically at times. This process brings about a pain in the chest which may spread into the arms and often causes breathlessness. Another common example of heart disease would be the heart attack also known as myocardial infarction. This is more severe than angina as it involves complete blockage of a coronary artery resulting in a section of the heart lacking an oxygen supply. A heart attack occurs as a result of a part of the heart being starved of oxygen. Strokes – this involves the blood supply to the brain being temporarily cut off. It can be caused by blockage in the artery due to plaque build-up or blood clots. What increases the risk of developing atherosclerosis? The risks of developing atherosclerosis can be increased by several factors some of which cannot be modified as you were born with it and some which can be modified by a change in lifestyle.
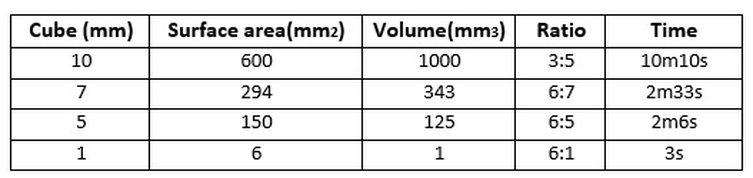
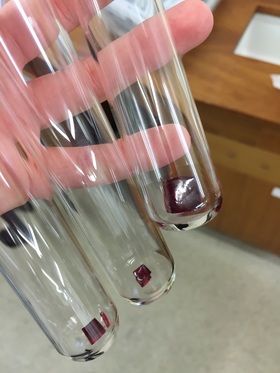
An experiment to investigate the effect of surface area : volume ratio on the diffusion rate.2/9/2016 The objectives of this experiment was to calculate the surface area to volume to ratio of pieces of agar and determine what effect this ratio had on the rate of diffusion. Equipment:
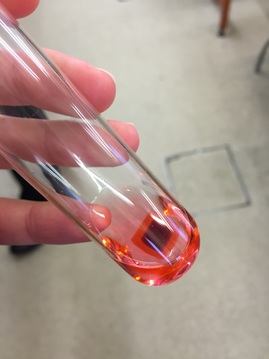
What happens when the agar is placed in the HCl? As time goes on the colour of the agar block becomes increasingly orange as it loses its pink colour. The reason for this is because of the hydrochloric acid diffusing into the block and making it lose its colour. The acid travels from an area of high concentration of HCl (in the test tube) to an area of low concentration of HCl (the agar cube) along a concentration gradient and the point at which the original colour has completely gone is when an even distribution of particles has been achieved. This experiment was designed to then see how this diffusion process occurred in different sized cubes and to investigate the difference I looked at the diffusion rate, i.e. how long it took for the pink colour to disappear. My prediction would be that the rate of diffusion would speed up as the surface area to volume ratio was increased, i.e. the cube was made smaller.
 Conclusion
From these results I can see that the surface area to volume ratio ad an effect on how fast diffusion occurred. As the agar cubes were cut smaller the ratio of surface area to volume became larger and this affected the diffusion rate by making it faster. The results show a clear trend that supports my knowledge on how the diffusion rate speeds up when there is a larger surface area to volume ratio. The time decreased which highlights how diffusion occurred quicker as there was more surface area in relation to its volume over which the HCl could diffuse over. Another reason for this increase in rate was due to the fact that the HCl particles had to travel longer distances in those agar cubes which had a larger volume in comparison to its surface area. Overall my results support the idea that as the surface area to volume ratio increases so does the rate of diffusion. This experiment relates to real life because single-celled organisms use diffusion as their means of getting the substances they need and expelling those they don’t. Diffusion works efficiently for single-celled organisms such as amoeba due to a large surface area to volume ratio as there is a relatively large surface area over which substances can diffuse into or out of the organism. This is demonstrated in my experiment as the smaller cubes with a larger surface area to volume ratio resemble single-celled organisms. My results also support the idea that large organisms cannot use diffusion as their means of transporting substances in and out, as shown by the 10mm by 10mm cube which took 10 minutes and 10 seconds for the HCl to diffuse all the way through. Diffusion would not be efficient enough for larger organisms as the surface area is not large enough for substances to diffuse over, as a result they require a complex transport system. This experiment does have its limitations as the organism’s cell is represented by a lifeless agar cube. It lacks a semi-permeable membrane and only allows for simple diffusion unlike real-life membranes. Cell surface membranes are much more sophisticated as they consist of a combination of phospholipids, carbohydrates and carrier/channel proteins. As well as this the shape of the agar cube does not resemble an organism’s cell. Apart from these limitations this experiment is a good way of demonstrating the effect of surface area to volume ratio on the rate of diffusion. |
Ciara Branagan
Archives
October 2016
|
 RSS Feed
